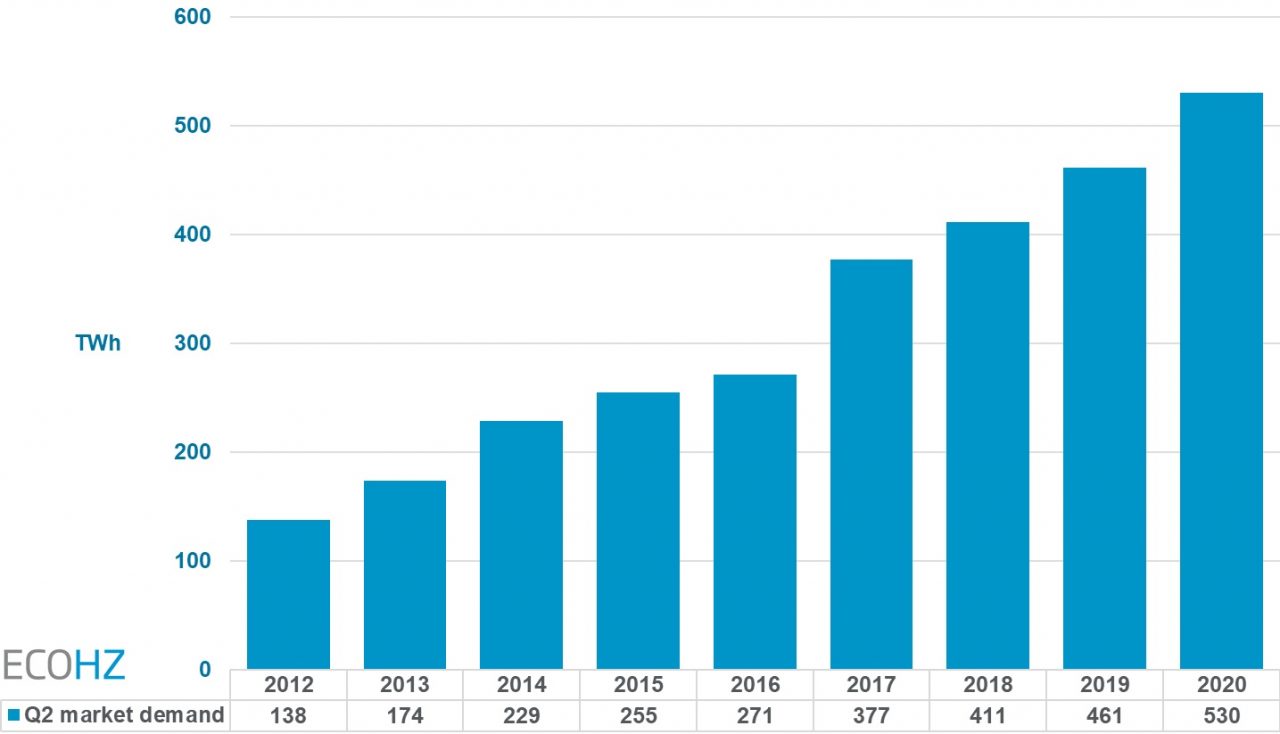
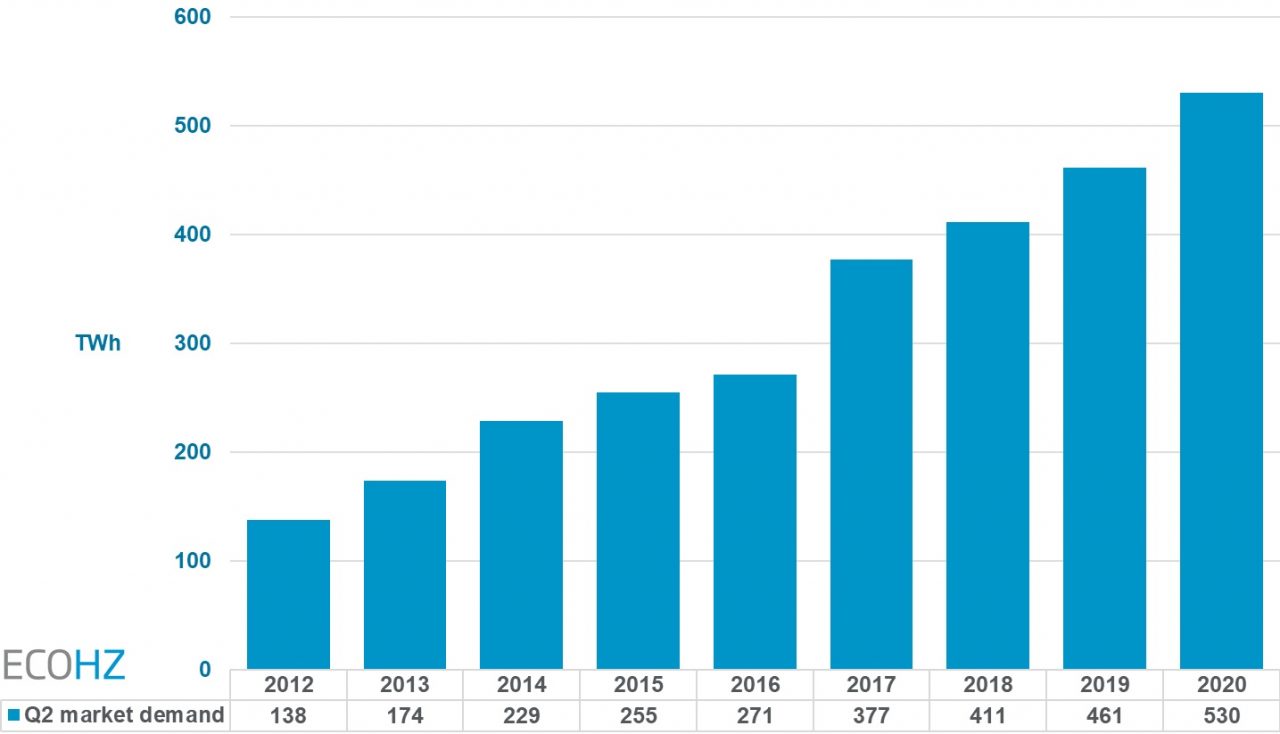
Demand in 2020 is up by a brisk 15% compared to the same period in 2019
Demand for renewables documented with Guarantees of Origin has steadily increased every year, and the annual growth (CAGR) is a robust 16% during the period from 2012 to 2020. A continued growth of 15% in 2020, is especially impressive given the presence of the COVID-19 pandemic.
Market demand for renewable energy with Guarantees of Origin (TWh) for YTD Q2 – 2012 to 2020
It is worth noting that the statistics are somehow skewed, meaning that the second half of the year traditionally shows significantly lower volumes. This means that annual figures for 2020 will not automatically be double of the first half year. But given that the market suddenly does not deflate, we will likely experience a record figure for the full 2020 as well.
Much of the continued growth is still likely coming from strong ambitions among a growing group of corporates with extensive energy use across international markets. We are also seeing the effect of numerous market and policy changes deployed the last few years. Among these are EU’s new Renewable Directive strengthening and clarifying the use of Guarantees of Origin. We also see a stronger emphasis to report and document sustainability results on global and local levels. In Europe specifically we see countries implementing various forms of Full Disclosure (FD) policy, with Holland deploying FD at the energy consumer level. This policy change creates increased transparency and will again result in increased demand. New platforms for allowing access to renewables have also appeared in 2019 and 2020, including various auction concepts in a select group of countries. Lastly, a nascent development to purchase and report renewables on a monthly basis, and in some cases on shorter time intervals (e.g. day, hour) also contributes to a more robust market. There are very few reasons these developments will not continue.

“Also, on a positive note is the inclusion of four new AIB countries in 2020 – Serbia, Slovakia, Greece and Portugal. These countries have contributed little to the volume growth so far in 2020 but will likely have a positive effect moving forward,” says Lindberg.
The supply side also continues to grow during 2020, across most national markets and all renewable technologies. Wind and solar has doubled, hydro has also grown and still dominates the market supply.
Revisiting market developments in 2019 – demand outpacing supply
“Even with a strong growth in the supply, market demand easily outpaced supply in 2019. Demand volumes was up by 18.5%, ending at 621 TWh and breaking the “600-barrier” for the first time”, remarks Lindberg. The 2019 growth is even more impressive given the that historical annual growth (CAGR) is 15.6% in the period from 2010 to 2019.
With a total supply of 667 TWh and demand at 621 TWh in 2019, the market surplus shrunk to 46 TWh – the lowest since 2015. This may indicate a development where the market will enjoy a better balance, and where prices again could start to rise.
Market development for renewables with Guarantees of Origin (TWh) 2006 – 2019
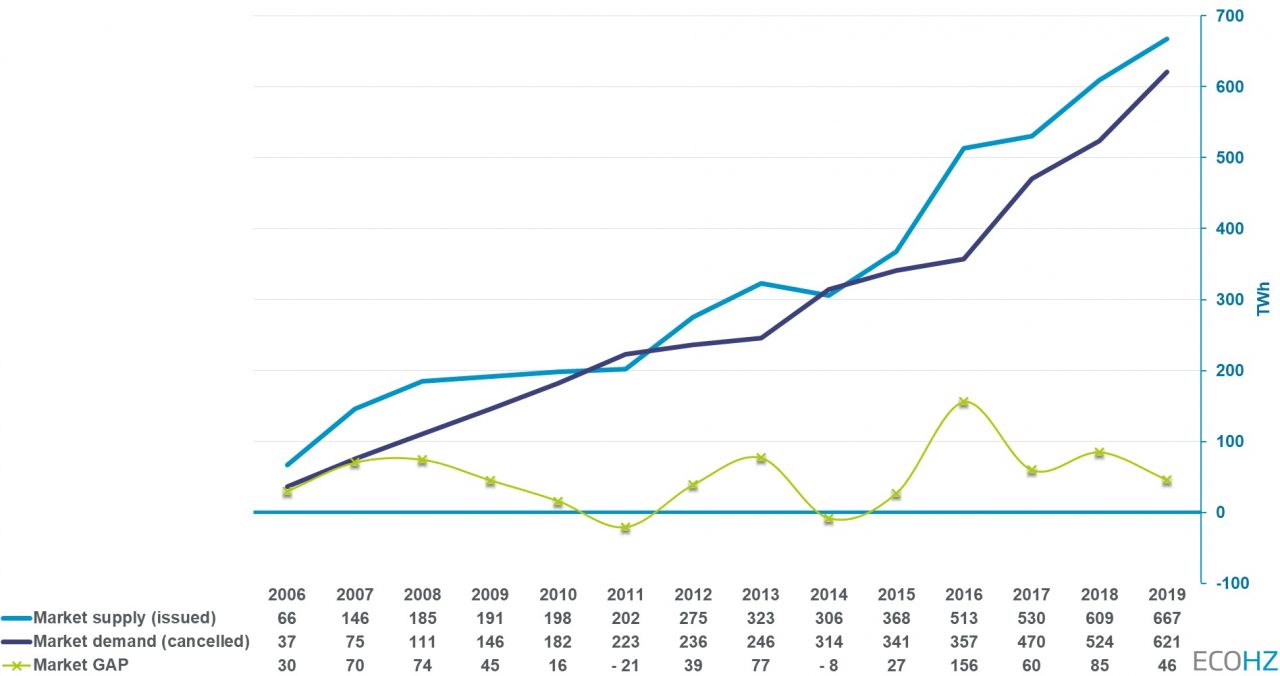
During earlier years one has often seen only a few countries contributing heavily to the growth. This has changed and we now see market growth across almost all national markets. This is very encouraging, and represents a robustness not experienced previously.
Wind and solar are the fastest growing technologies
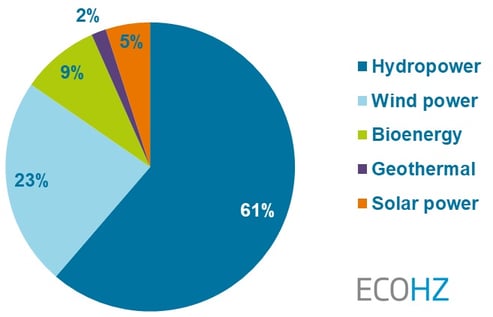
“Hydropower has provided much of the renewable energy with Guarantees of Origin in Europe and still has a big share, but changes are occurring rapidly. Hydropower’s share fell from 64% in 2018, to 61% in 2019. It is also worth noting that hydropower’s share was approximately 90% 10 years ago. The falling share of hydro can primarily be explained by increased availability of both solar and wind,” states Lindberg. Wind has grown fast, from a 19% share in 2018, to 23% in 2019. Solar’s share is still small but has grown to a 5% share in 2019. Both technologies are expecting to continue to grasp market share from hydro.
Market supply (issued) Guarantees of Origin per technology 2019
The forces behind the renewable energy demand
Households, organisations and businesses all contribute to the market growth. But the corporate sector is the main driver because more corporations see sustainability as necessary for future competitiveness. Several initiatives exist to support corporate sustainability ambitions. Two notable initiatives are WeMeanBusiness and RE100.
The RE100 initiative now has over 260 members – the world’s most influential businesses that have made a commitment to go ‘100% renewable’. Global reporting initiatives like CDP and Greenhouse Gas Protocol are enabling this movement. Also, EU with the REDII is strengthening the Guarantees of Origin system by further embedding it into European legislation.
The above is a commentary based on figures published by AIB (Association of Issuing Bodies). The Q2 2020 figures reported by the AIB, partly included figures related to Q3 for some countries, but have been corrected accordingly to create a consistent dataset, comparable to 2019.

.png?width=3840&height=2560&name=Sun(1).png)

.png?width=3840&height=2560&name=Landscape_2(1).png)
